
Fatigue Test
Meta
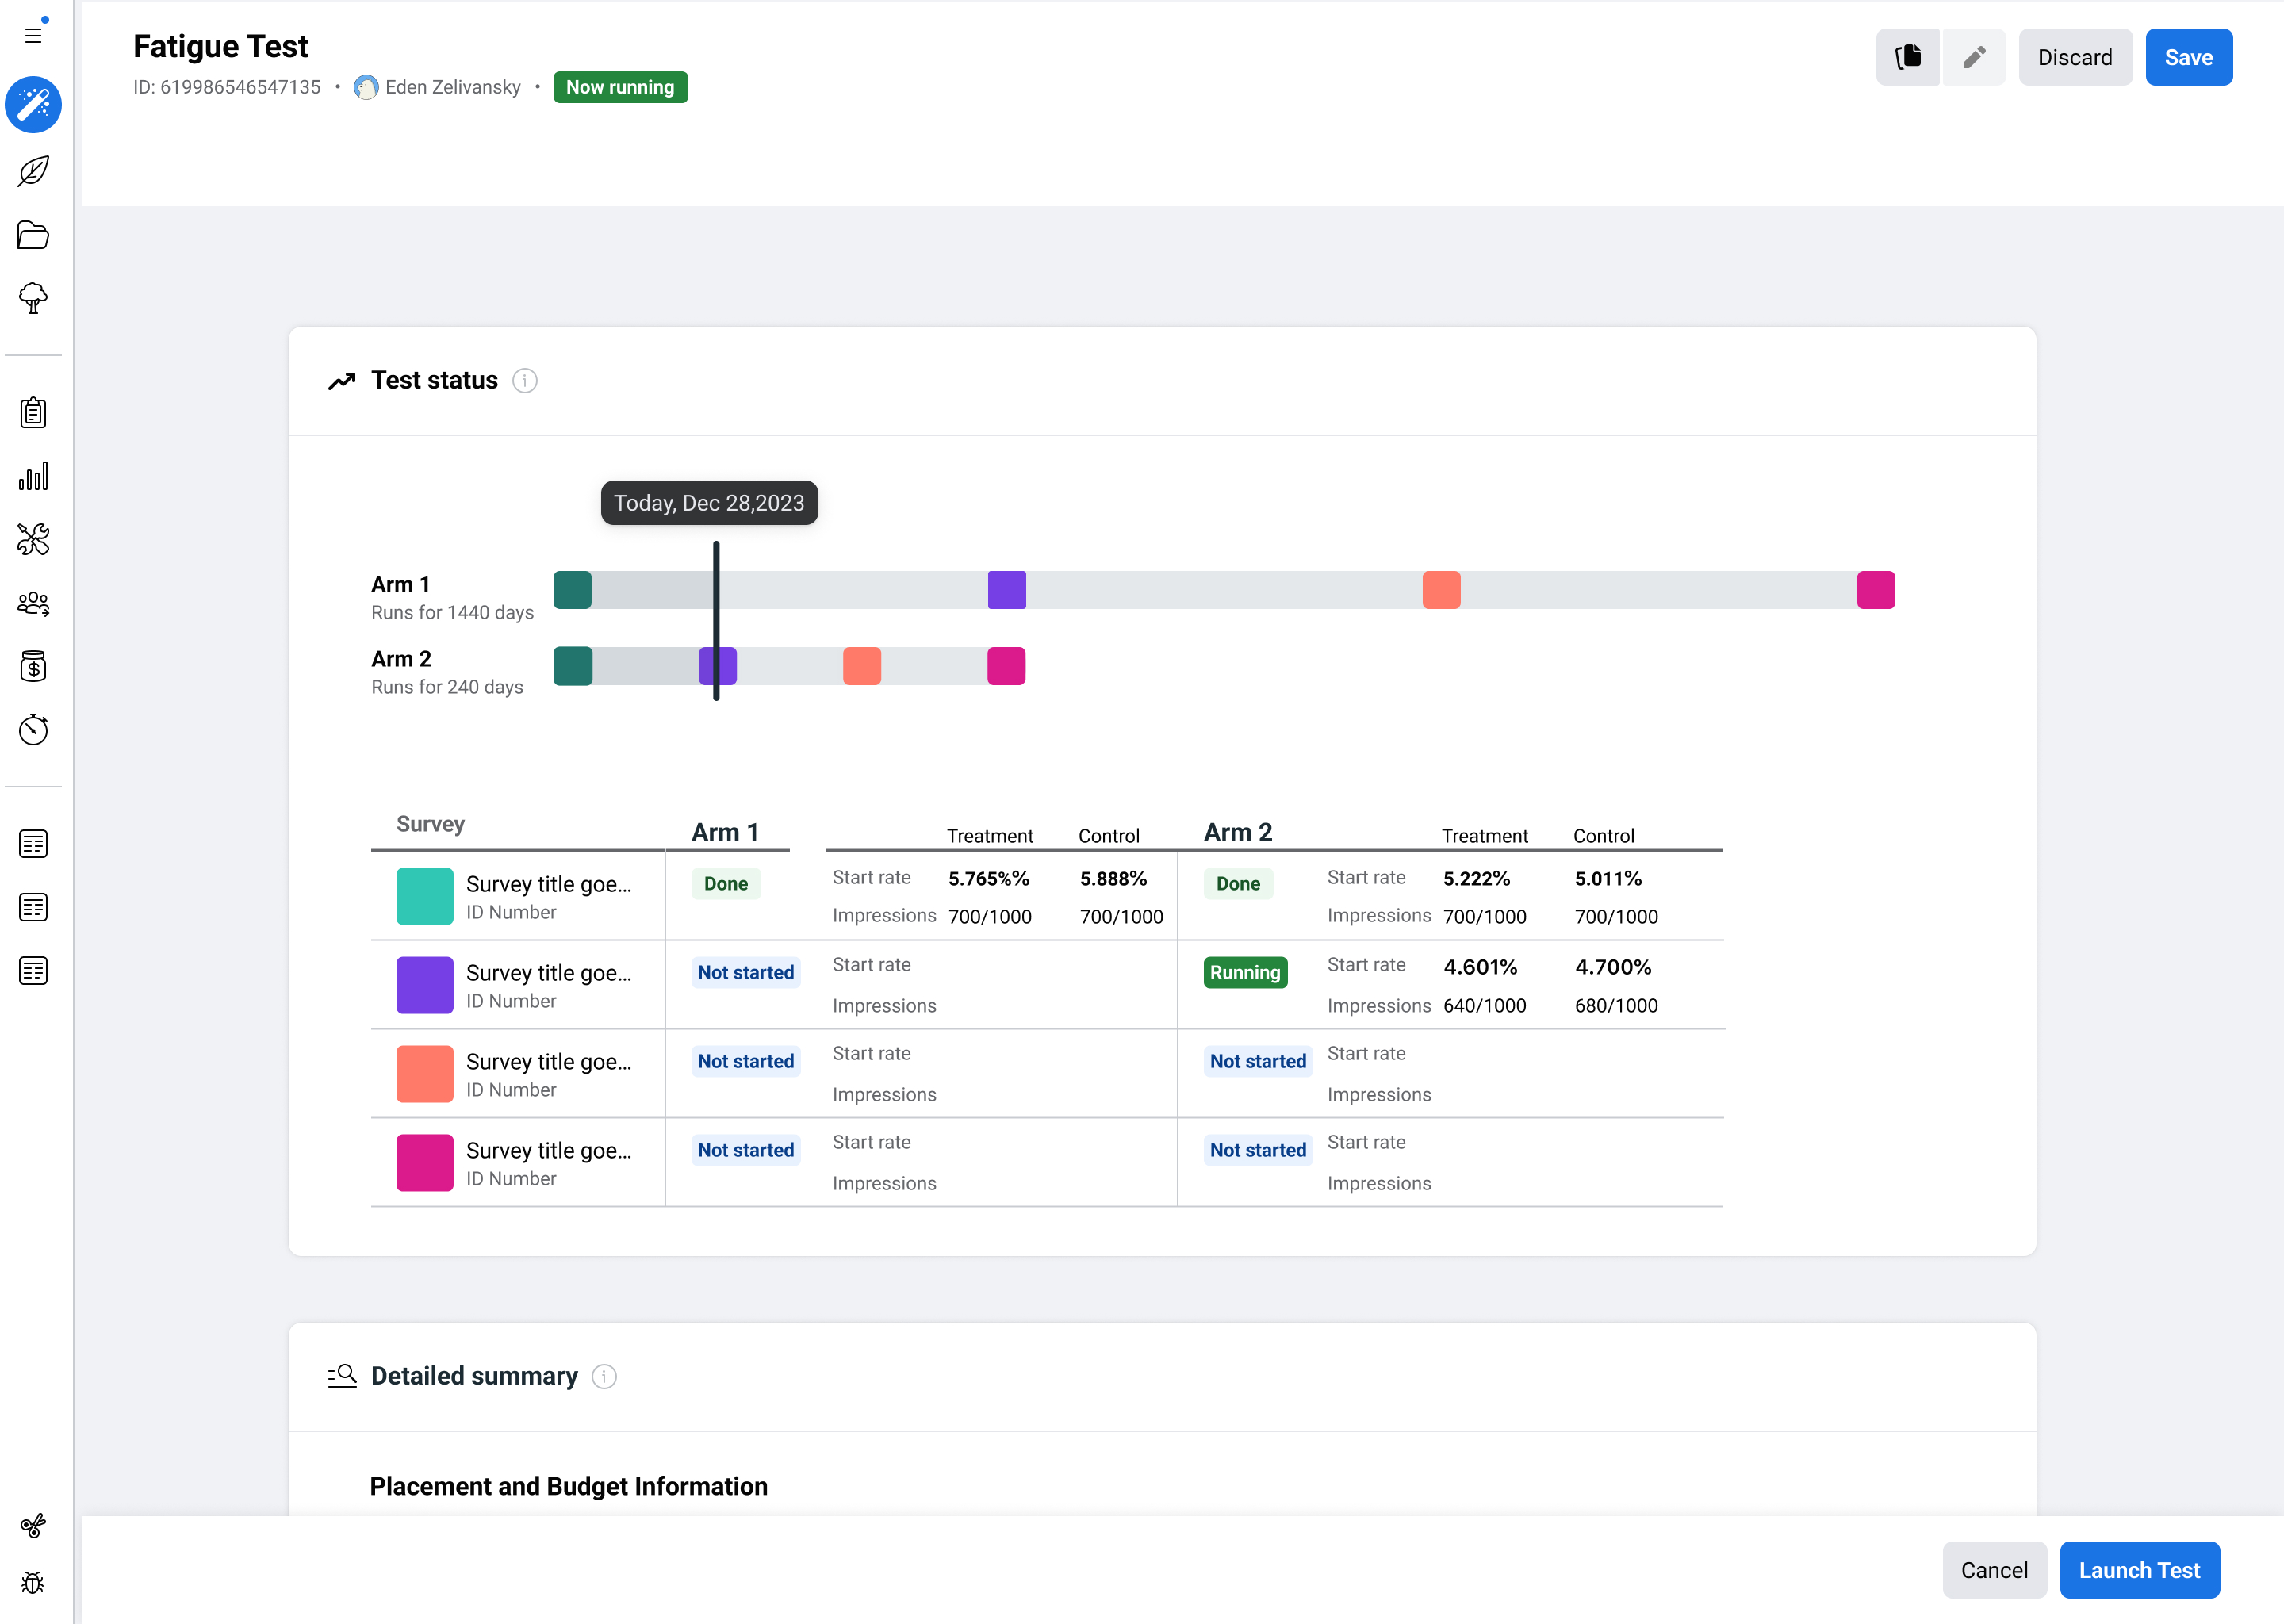
The test consists of multiple "arms" and each arm contains several "waves". Each arm represents a series of surveys that a specific group of users will receive, with each wave triggering the distribution of a survey to the relevant group. In addition, a control group will receive the same survey as the test group.
Once the feature is launched, a status page becomes accessible, providing details on the collected data. The information is organized and displayed according to its significance and its alignment with the primary objective of the tool.
What is Fatifue test?
Meta has a complex system allowing users to create a survey and distribute it across all the Meta family of apps. The users are internal, mainly Meta’s researchers and engineers.
The goal is to identify the ideal duration for the "cool-down policy" between surveys for users. Proving that a shorter cool-down period between surveys is feasible can result in a larger volume of collected data, while also providing more insights into the general exposure of each user.
More about the project can be read from desktop
Fatigue Test
Meta
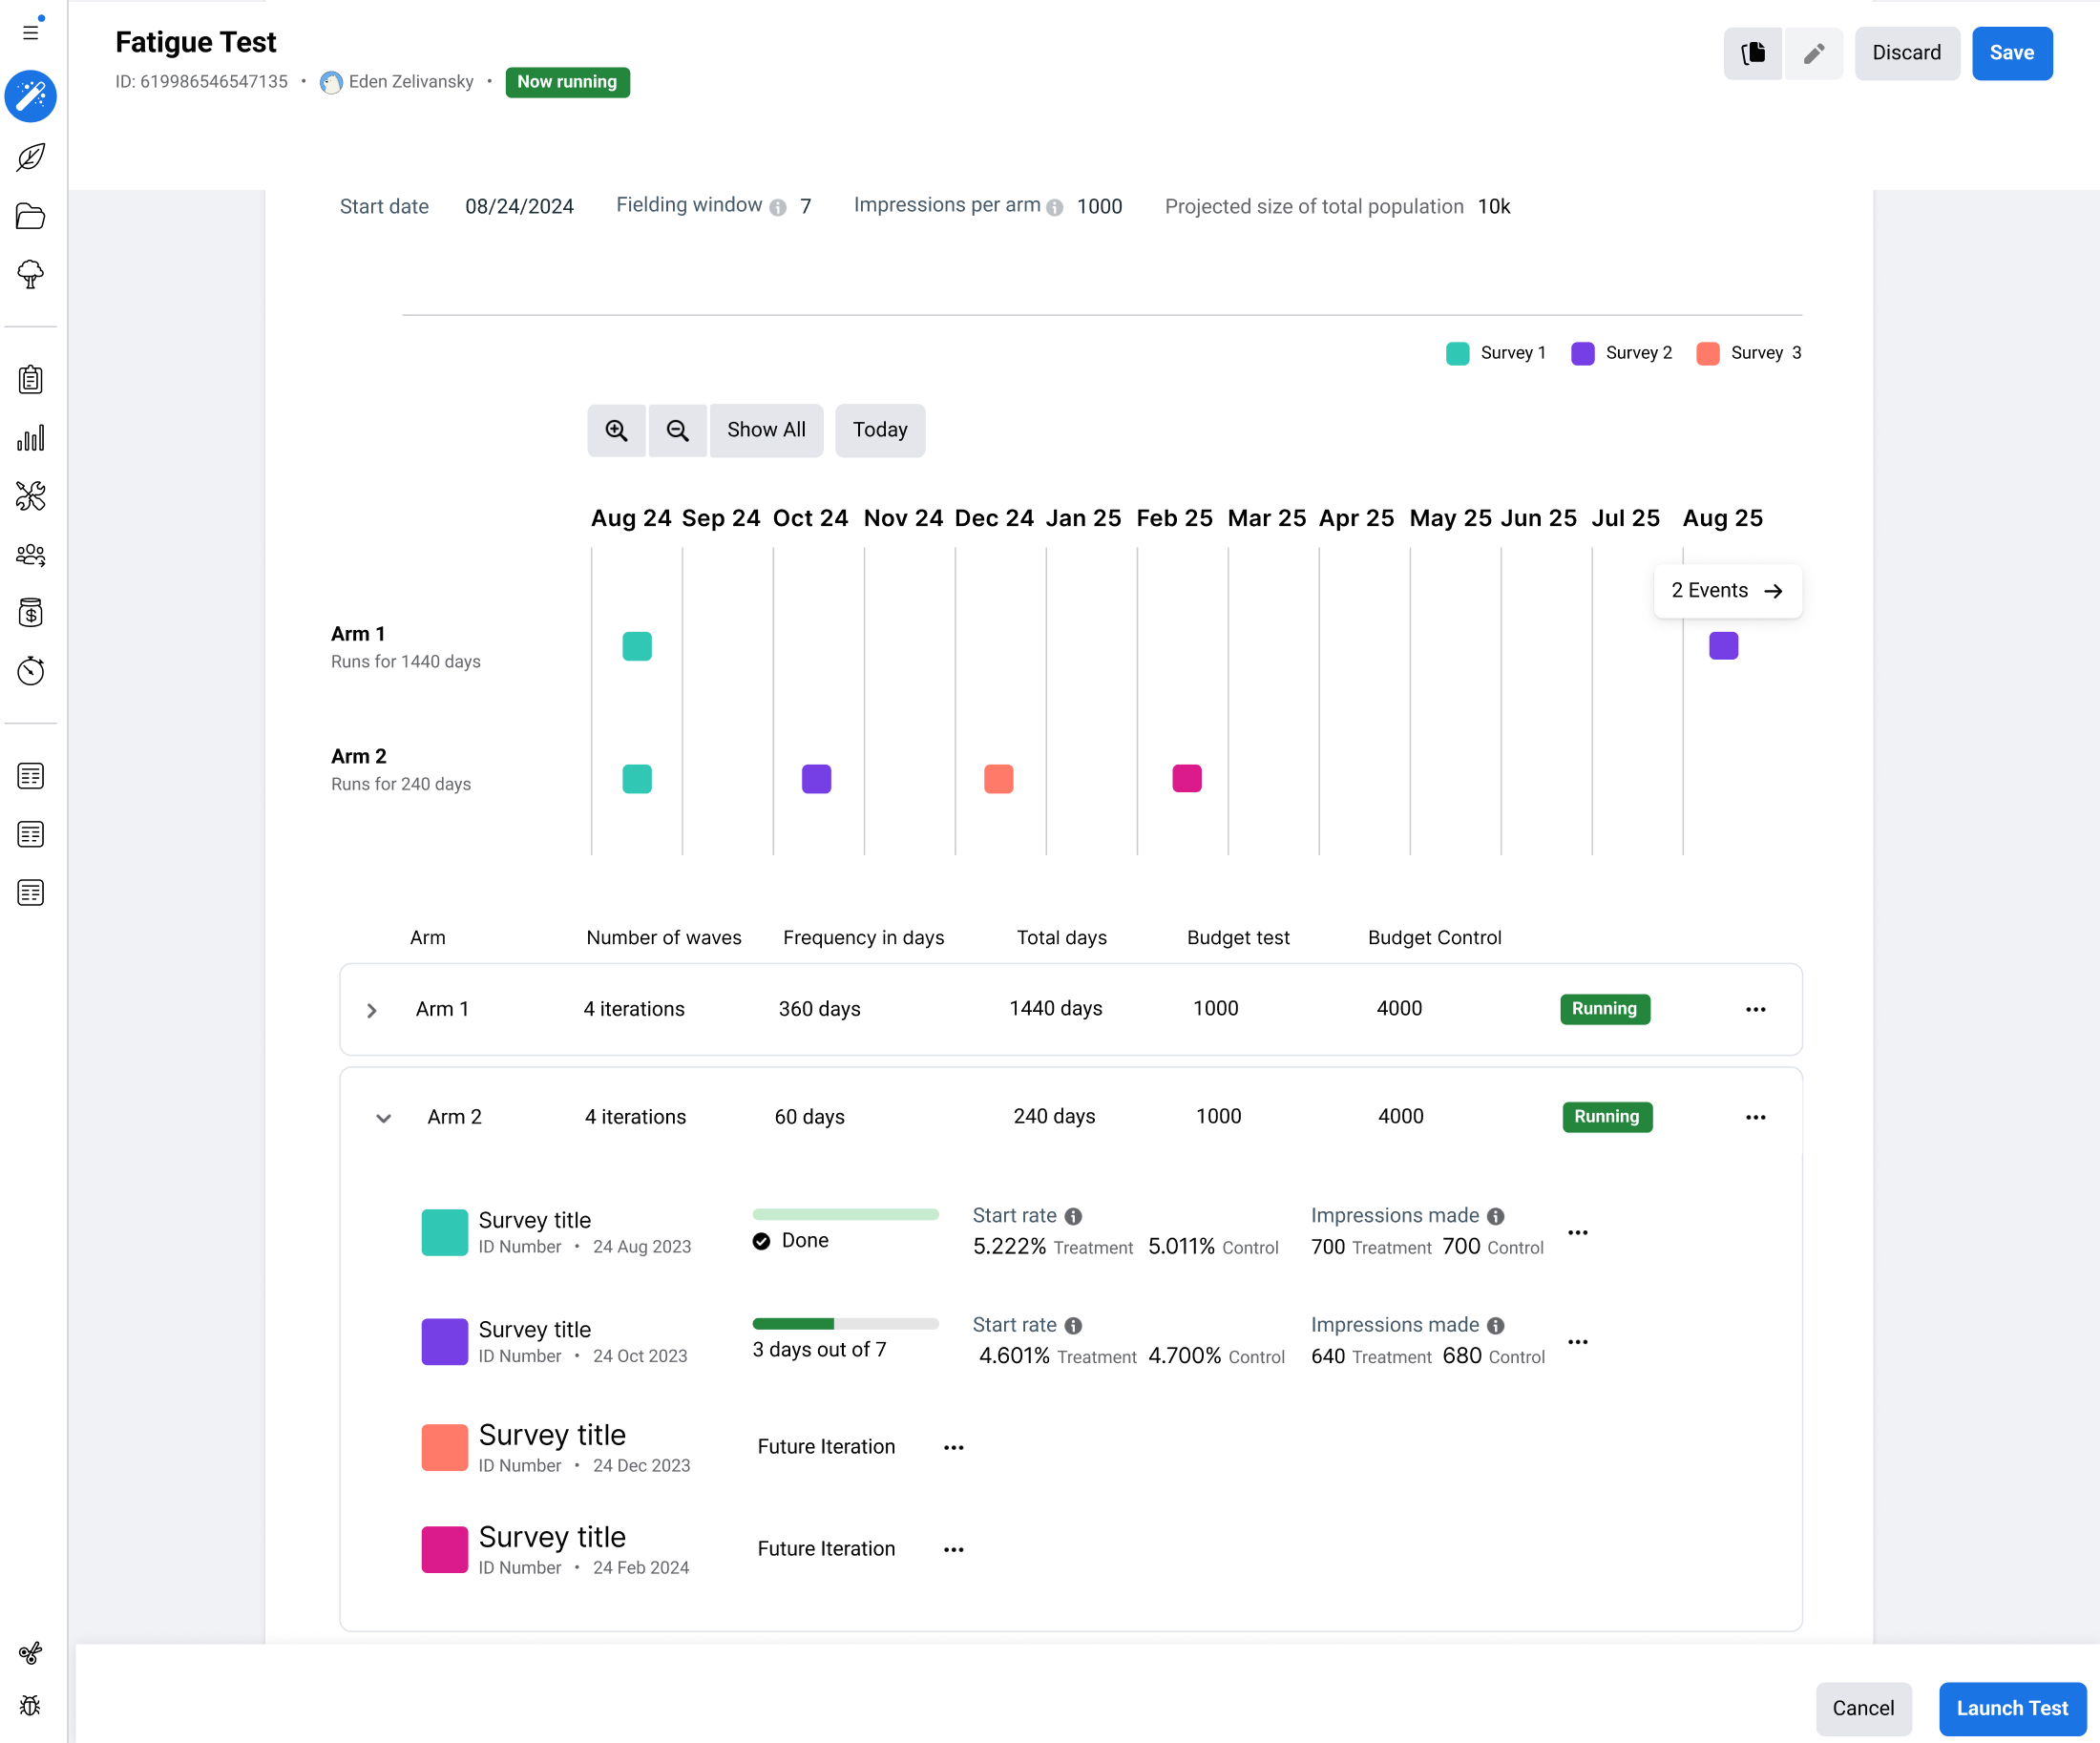
The test consists of multiple "arms" and each arm contains several "waves". Each arm represents a series of surveys that a specific group of users will receive, with each wave triggering the distribution of a survey to the relevant group. In addition, a control group will receive the same survey as the test group.
Once the feature is launched, a status page becomes accessible, providing details on the collected data. The information is organized and displayed according to its significance and its alignment with the primary objective of the tool.
What is Fatifue test?
Meta has a complex system allowing users to create a survey and distribute it across all the Meta family of apps. The users are internal, mainly Meta’s researchers and engineers.
The goal is to identify the ideal duration for the "cool-down policy" between surveys for users. Proving that a shorter cool-down period between surveys is feasible can result in a larger volume of collected data, while also providing more insights into the general exposure of each user.
Challenge
Designing a sophisticated yet user-friendly tool to manage survey distribution across all Meta apps, while determining the optimal cooldown duration between surveys.
Anecdote
To simplify the complex feature of survey cooldown,
I employed visualization techniques that organized time and delivered real-time data at every stage of the test. During the audit stage, I explored various tools both within and outside of Meta, which led to a breakthrough in how we visualized data and information that is collected in a long-time tests.
Outcome
Successfully developed a survey distribution system that allowed targeted, customizable survey deployment across Meta’s family of apps.
Created a friction-free, intuitive user interface that improved the experience for researchers, supporting long-term research efforts
The visualization techniques used in the design enabled real-time tracking and analysis, contributing to more accurate and actionable insights for researchers.
The project fostered collaboration across researchers, engineers, and product experts, leading to a highly effective tool, which is currently active and undergoing testing.